Lecture Notes 12#
import numpy as np
import matplotlib.pyplot as plt
A more object oriented approch to plotting
work with figure and axes objects
plt.subplots()
(<Figure size 640x480 with 1 Axes>, <Axes: >)
plt.subplots(nrows=2)
(<Figure size 640x480 with 2 Axes>, array([<Axes: >, <Axes: >], dtype=object))
plt.subplots(ncols=2)
(<Figure size 640x480 with 2 Axes>, array([<Axes: >, <Axes: >], dtype=object))
fig, ax = plt.subplots()
dir(ax)
['ArtistList',
 '_AxesBase__clear',
 '_PROPERTIES_EXCLUDED_FROM_SET',
 '__class__',
 '__delattr__',
 '__dict__',
 '__dir__',
 '__doc__',
 '__eq__',
 '__format__',
 '__ge__',
 '__getattribute__',
 '__getstate__',
 '__gt__',
 '__hash__',
 '__init__',
 '__init_subclass__',
 '__le__',
 '__lt__',
 '__module__',
 '__ne__',
 '__new__',
 '__reduce__',
 '__reduce_ex__',
 '__repr__',
 '__setattr__',
 '__setstate__',
 '__sizeof__',
 '__str__',
 '__subclasshook__',
 '__weakref__',
 '_add_text',
 '_adjustable',
 '_agg_filter',
 '_alias_map',
 '_alpha',
 '_anchor',
 '_animated',
 '_aspect',
 '_autotitlepos',
 '_axes',
 '_axes_locator',
 '_axis_map',
 '_axis_names',
 '_axisbelow',
 '_box_aspect',
 '_callbacks',
 '_check_no_units',
 '_children',
 '_clipon',
 '_clippath',
 '_cm_set',
 '_colorbars',
 '_convert_dx',
 '_current_image',
 '_default_contains',
 '_errorevery_to_mask',
 '_facecolor',
 '_fill_between_x_or_y',
 '_frameon',
 '_fully_clipped_to_axes',
 '_gci',
 '_gen_axes_patch',
 '_gen_axes_spines',
 '_get_aspect_ratio',
 '_get_lines',
 '_get_pan_points',
 '_get_patches_for_fill',
 '_get_view',
 '_gid',
 '_gridOn',
 '_in_layout',
 '_init_axis',
 '_internal_update',
 '_label',
 '_label_outer_xaxis',
 '_label_outer_yaxis',
 '_left_title',
 '_make_twin_axes',
 '_mouseover',
 '_mouseover_set',
 '_navigate',
 '_navigate_mode',
 '_originalPosition',
 '_parse_scatter_color_args',
 '_path_effects',
 '_pcolorargs',
 '_picker',
 '_position',
 '_prepare_view_from_bbox',
 '_process_unit_info',
 '_projection_init',
 '_quiver_units',
 '_rasterization_zorder',
 '_rasterized',
 '_remove_legend',
 '_remove_method',
 '_request_autoscale_view',
 '_right_title',
 '_sci',
 '_set_alpha_for_array',
 '_set_artist_props',
 '_set_gc_clip',
 '_set_lim_and_transforms',
 '_set_position',
 '_set_title_offset_trans',
 '_set_view',
 '_set_view_from_bbox',
 '_shared_axes',
 '_sharex',
 '_sharey',
 '_sketch',
 '_snap',
 '_stale',
 '_stale_viewlims',
 '_sticky_edges',
 '_subclass_uses_cla',
 '_subplotspec',
 '_tight',
 '_transform',
 '_transformSet',
 '_twinned_axes',
 '_unit_change_handler',
 '_unstale_viewLim',
 '_update_image_limits',
 '_update_line_limits',
 '_update_patch_limits',
 '_update_props',
 '_update_set_signature_and_docstring',
 '_update_title_position',
 '_update_transScale',
 '_url',
 '_use_sticky_edges',
 '_validate_converted_limits',
 '_viewLim',
 '_visible',
 '_xaxis_transform',
 '_xmargin',
 '_yaxis_transform',
 '_ymargin',
 'acorr',
 'add_artist',
 'add_callback',
 'add_child_axes',
 'add_collection',
 'add_container',
 'add_image',
 'add_line',
 'add_patch',
 'add_table',
 'angle_spectrum',
 'annotate',
 'apply_aspect',
 'arrow',
 'artists',
 'autoscale',
 'autoscale_view',
 'axes',
 'axhline',
 'axhspan',
 'axis',
 'axison',
 'axline',
 'axvline',
 'axvspan',
 'bar',
 'bar_label',
 'barbs',
 'barh',
 'bbox',
 'boxplot',
 'broken_barh',
 'bxp',
 'callbacks',
 'can_pan',
 'can_zoom',
 'child_axes',
 'cla',
 'clabel',
 'clear',
 'clipbox',
 'cohere',
 'collections',
 'containers',
 'contains',
 'contains_point',
 'contour',
 'contourf',
 'convert_xunits',
 'convert_yunits',
 'csd',
 'dataLim',
 'drag_pan',
 'draw',
 'draw_artist',
 'end_pan',
 'errorbar',
 'eventplot',
 'figure',
 'fill',
 'fill_between',
 'fill_betweenx',
 'findobj',
 'fmt_xdata',
 'fmt_ydata',
 'format_coord',
 'format_cursor_data',
 'format_xdata',
 'format_ydata',
 'get_adjustable',
 'get_agg_filter',
 'get_alpha',
 'get_anchor',
 'get_animated',
 'get_aspect',
 'get_autoscale_on',
 'get_autoscalex_on',
 'get_autoscaley_on',
 'get_axes_locator',
 'get_axisbelow',
 'get_box_aspect',
 'get_children',
 'get_clip_box',
 'get_clip_on',
 'get_clip_path',
 'get_cursor_data',
 'get_data_ratio',
 'get_default_bbox_extra_artists',
 'get_facecolor',
 'get_fc',
 'get_figure',
 'get_frame_on',
 'get_gid',
 'get_gridspec',
 'get_images',
 'get_in_layout',
 'get_label',
 'get_legend',
 'get_legend_handles_labels',
 'get_lines',
 'get_mouseover',
 'get_navigate',
 'get_navigate_mode',
 'get_path_effects',
 'get_picker',
 'get_position',
 'get_rasterization_zorder',
 'get_rasterized',
 'get_renderer_cache',
 'get_shared_x_axes',
 'get_shared_y_axes',
 'get_sketch_params',
 'get_snap',
 'get_subplotspec',
 'get_tightbbox',
 'get_title',
 'get_transform',
 'get_transformed_clip_path_and_affine',
 'get_url',
 'get_visible',
 'get_window_extent',
 'get_xaxis',
 'get_xaxis_text1_transform',
 'get_xaxis_text2_transform',
 'get_xaxis_transform',
 'get_xbound',
 'get_xgridlines',
 'get_xlabel',
 'get_xlim',
 'get_xmajorticklabels',
 'get_xminorticklabels',
 'get_xscale',
 'get_xticklabels',
 'get_xticklines',
 'get_xticks',
 'get_yaxis',
 'get_yaxis_text1_transform',
 'get_yaxis_text2_transform',
 'get_yaxis_transform',
 'get_ybound',
 'get_ygridlines',
 'get_ylabel',
 'get_ylim',
 'get_ymajorticklabels',
 'get_yminorticklabels',
 'get_yscale',
 'get_yticklabels',
 'get_yticklines',
 'get_yticks',
 'get_zorder',
 'grid',
 'has_data',
 'have_units',
 'hexbin',
 'hist',
 'hist2d',
 'hlines',
 'ignore_existing_data_limits',
 'images',
 'imshow',
 'in_axes',
 'indicate_inset',
 'indicate_inset_zoom',
 'inset_axes',
 'invert_xaxis',
 'invert_yaxis',
 'is_transform_set',
 'label_outer',
 'legend',
 'legend_',
 'lines',
 'locator_params',
 'loglog',
 'magnitude_spectrum',
 'margins',
 'matshow',
 'minorticks_off',
 'minorticks_on',
 'mouseover',
 'name',
 'patch',
 'patches',
 'pchanged',
 'pcolor',
 'pcolorfast',
 'pcolormesh',
 'phase_spectrum',
 'pick',
 'pickable',
 'pie',
 'plot',
 'plot_date',
 'properties',
 'psd',
 'quiver',
 'quiverkey',
 'redraw_in_frame',
 'relim',
 'remove',
 'remove_callback',
 'reset_position',
 'scatter',
 'secondary_xaxis',
 'secondary_yaxis',
 'semilogx',
 'semilogy',
 'set',
 'set_adjustable',
 'set_agg_filter',
 'set_alpha',
 'set_anchor',
 'set_animated',
 'set_aspect',
 'set_autoscale_on',
 'set_autoscalex_on',
 'set_autoscaley_on',
 'set_axes_locator',
 'set_axis_off',
 'set_axis_on',
 'set_axisbelow',
 'set_box_aspect',
 'set_clip_box',
 'set_clip_on',
 'set_clip_path',
 'set_facecolor',
 'set_fc',
 'set_figure',
 'set_frame_on',
 'set_gid',
 'set_in_layout',
 'set_label',
 'set_mouseover',
 'set_navigate',
 'set_navigate_mode',
 'set_path_effects',
 'set_picker',
 'set_position',
 'set_prop_cycle',
 'set_rasterization_zorder',
 'set_rasterized',
 'set_sketch_params',
 'set_snap',
 'set_subplotspec',
 'set_title',
 'set_transform',
 'set_url',
 'set_visible',
 'set_xbound',
 'set_xlabel',
 'set_xlim',
 'set_xmargin',
 'set_xscale',
 'set_xticklabels',
 'set_xticks',
 'set_ybound',
 'set_ylabel',
 'set_ylim',
 'set_ymargin',
 'set_yscale',
 'set_yticklabels',
 'set_yticks',
 'set_zorder',
 'sharex',
 'sharey',
 'specgram',
 'spines',
 'spy',
 'stackplot',
 'stairs',
 'stale',
 'stale_callback',
 'start_pan',
 'stem',
 'step',
 'sticky_edges',
 'streamplot',
 'table',
 'tables',
 'text',
 'texts',
 'tick_params',
 'ticklabel_format',
 'title',
 'titleOffsetTrans',
 'transAxes',
 'transData',
 'transLimits',
 'transScale',
 'tricontour',
 'tricontourf',
 'tripcolor',
 'triplot',
 'twinx',
 'twiny',
 'update',
 'update_datalim',
 'update_from',
 'use_sticky_edges',
 'viewLim',
 'violin',
 'violinplot',
 'vlines',
 'xaxis',
 'xaxis_date',
 'xaxis_inverted',
 'xcorr',
 'yaxis',
 'yaxis_date',
 'yaxis_inverted',
 'zorder']
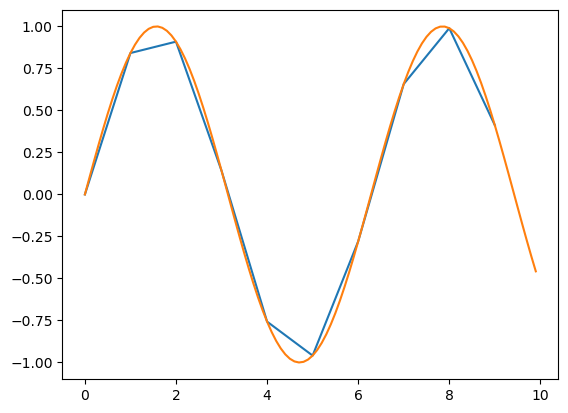
x = np.arange(10)
y = np.sin(x)
ax.plot(x, y)
fig
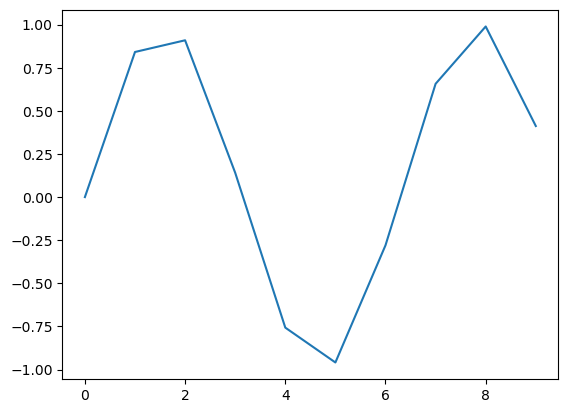
x = np.arange(0, 10, .1)
y = np.sin(x)
ax.plot(x, y)
fig
dir(fig)
['_PROPERTIES_EXCLUDED_FROM_SET',
 '__class__',
 '__delattr__',
 '__dict__',
 '__dir__',
 '__doc__',
 '__eq__',
 '__format__',
 '__ge__',
 '__getattribute__',
 '__getstate__',
 '__gt__',
 '__hash__',
 '__init__',
 '__init_subclass__',
 '__le__',
 '__lt__',
 '__module__',
 '__ne__',
 '__new__',
 '__reduce__',
 '__reduce_ex__',
 '__repr__',
 '__setattr__',
 '__setstate__',
 '__sizeof__',
 '__str__',
 '__subclasshook__',
 '__weakref__',
 '_add_axes_internal',
 '_agg_filter',
 '_align_label_groups',
 '_alpha',
 '_animated',
 '_axobservers',
 '_axstack',
 '_button_pick_id',
 '_callbacks',
 '_canvas_callbacks',
 '_check_layout_engines_compat',
 '_clipon',
 '_clippath',
 '_cm_set',
 '_default_contains',
 '_dpi',
 '_fig_callbacks',
 '_fully_clipped_to_axes',
 '_gci',
 '_get_dpi',
 '_get_draw_artists',
 '_get_renderer',
 '_gid',
 '_in_layout',
 '_internal_update',
 '_label',
 '_layout_engine',
 '_localaxes',
 '_mouse_key_ids',
 '_mouseover',
 '_norm_per_subplot_kw',
 '_normalize_grid_string',
 '_original_dpi',
 '_path_effects',
 '_picker',
 '_process_projection_requirements',
 '_rasterized',
 '_remove_method',
 '_repr_html_',
 '_scroll_pick_id',
 '_set_alpha_for_array',
 '_set_artist_props',
 '_set_dpi',
 '_set_gc_clip',
 '_sketch',
 '_snap',
 '_stale',
 '_sticky_edges',
 '_suplabels',
 '_suptitle',
 '_supxlabel',
 '_supylabel',
 '_transform',
 '_transformSet',
 '_update_props',
 '_update_set_signature_and_docstring',
 '_url',
 '_visible',
 'add_artist',
 'add_axes',
 'add_axobserver',
 'add_callback',
 'add_gridspec',
 'add_subfigure',
 'add_subplot',
 'align_labels',
 'align_xlabels',
 'align_ylabels',
 'artists',
 'autofmt_xdate',
 'axes',
 'bbox',
 'bbox_inches',
 'callbacks',
 'canvas',
 'clear',
 'clf',
 'clipbox',
 'colorbar',
 'contains',
 'convert_xunits',
 'convert_yunits',
 'delaxes',
 'dpi',
 'dpi_scale_trans',
 'draw',
 'draw_artist',
 'draw_without_rendering',
 'execute_constrained_layout',
 'figbbox',
 'figimage',
 'figure',
 'findobj',
 'format_cursor_data',
 'frameon',
 'gca',
 'get_agg_filter',
 'get_alpha',
 'get_animated',
 'get_axes',
 'get_children',
 'get_clip_box',
 'get_clip_on',
 'get_clip_path',
 'get_constrained_layout',
 'get_constrained_layout_pads',
 'get_cursor_data',
 'get_default_bbox_extra_artists',
 'get_dpi',
 'get_edgecolor',
 'get_facecolor',
 'get_figheight',
 'get_figure',
 'get_figwidth',
 'get_frameon',
 'get_gid',
 'get_in_layout',
 'get_label',
 'get_layout_engine',
 'get_linewidth',
 'get_mouseover',
 'get_path_effects',
 'get_picker',
 'get_rasterized',
 'get_size_inches',
 'get_sketch_params',
 'get_snap',
 'get_tight_layout',
 'get_tightbbox',
 'get_transform',
 'get_transformed_clip_path_and_affine',
 'get_url',
 'get_visible',
 'get_window_extent',
 'get_zorder',
 'ginput',
 'have_units',
 'images',
 'is_transform_set',
 'legend',
 'legends',
 'lines',
 'mouseover',
 'number',
 'patch',
 'patches',
 'pchanged',
 'pick',
 'pickable',
 'properties',
 'remove',
 'remove_callback',
 'savefig',
 'sca',
 'set',
 'set_agg_filter',
 'set_alpha',
 'set_animated',
 'set_canvas',
 'set_clip_box',
 'set_clip_on',
 'set_clip_path',
 'set_constrained_layout',
 'set_constrained_layout_pads',
 'set_dpi',
 'set_edgecolor',
 'set_facecolor',
 'set_figheight',
 'set_figure',
 'set_figwidth',
 'set_frameon',
 'set_gid',
 'set_in_layout',
 'set_label',
 'set_layout_engine',
 'set_linewidth',
 'set_mouseover',
 'set_path_effects',
 'set_picker',
 'set_rasterized',
 'set_size_inches',
 'set_sketch_params',
 'set_snap',
 'set_tight_layout',
 'set_transform',
 'set_url',
 'set_visible',
 'set_zorder',
 'show',
 'stale',
 'stale_callback',
 'sticky_edges',
 'subfigs',
 'subfigures',
 'subplot_mosaic',
 'subplotpars',
 'subplots',
 'subplots_adjust',
 'suppressComposite',
 'suptitle',
 'supxlabel',
 'supylabel',
 'text',
 'texts',
 'tight_layout',
 'transFigure',
 'transSubfigure',
 'update',
 'update_from',
 'waitforbuttonpress',
 'zorder']
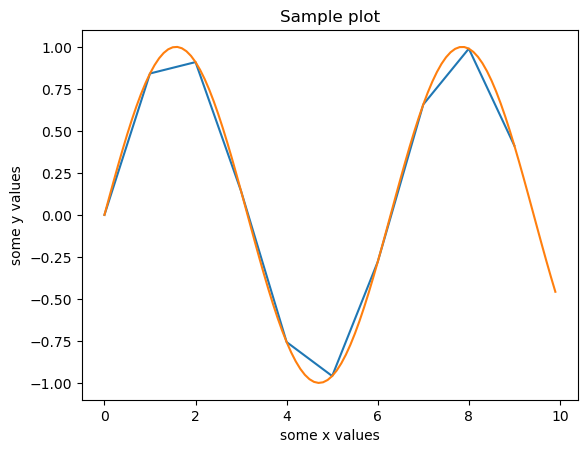
fig.savefig('sample.png')
Other attribures of axes
ax.set_title('Sample plot')
ax.set_xlabel('some x values')
ax.set_ylabel('some y values')
fig
Pandas#
import pandas as pd
s = pd.Series([0.1, 0.2, 0.3, 0.4])
s.index
RangeIndex(start=0, stop=4, step=1)
s.values
array([0.1, 0.2, 0.3, 0.4])
s[0:2]
0    0.1
1    0.2
dtype: float64
s = pd.Series({'a': 1, 'b': 2, 'c': 3, 'd': 4})
s
a    1
b    2
c    3
d    4
dtype: int64
s['a': 'c']
a    1
b    2
c    3
dtype: int64
s[['a', 'c']]
a    1
c    3
dtype: int64
s
a    1
b    2
c    3
d    4
dtype: int64
s + s
a    2
b    4
c    6
d    8
dtype: int64
s > 2
a    False
b    False
c     True
d     True
dtype: bool
s[[False, False, True, True]]
c    3
d    4
dtype: int64
s[s>2]
c    3
d    4
dtype: int64
dir(s)
['T',
 '_AXIS_LEN',
 '_AXIS_ORDERS',
 '_AXIS_TO_AXIS_NUMBER',
 '_HANDLED_TYPES',
 '__abs__',
 '__add__',
 '__and__',
 '__annotations__',
 '__array__',
 '__array_priority__',
 '__array_ufunc__',
 '__array_wrap__',
 '__bool__',
 '__class__',
 '__contains__',
 '__copy__',
 '__deepcopy__',
 '__delattr__',
 '__delitem__',
 '__dict__',
 '__dir__',
 '__divmod__',
 '__doc__',
 '__eq__',
 '__finalize__',
 '__float__',
 '__floordiv__',
 '__format__',
 '__ge__',
 '__getattr__',
 '__getattribute__',
 '__getitem__',
 '__getstate__',
 '__gt__',
 '__hash__',
 '__iadd__',
 '__iand__',
 '__ifloordiv__',
 '__imod__',
 '__imul__',
 '__init__',
 '__init_subclass__',
 '__int__',
 '__invert__',
 '__ior__',
 '__ipow__',
 '__isub__',
 '__iter__',
 '__itruediv__',
 '__ixor__',
 '__le__',
 '__len__',
 '__long__',
 '__lt__',
 '__matmul__',
 '__mod__',
 '__module__',
 '__mul__',
 '__ne__',
 '__neg__',
 '__new__',
 '__nonzero__',
 '__or__',
 '__pos__',
 '__pow__',
 '__radd__',
 '__rand__',
 '__rdivmod__',
 '__reduce__',
 '__reduce_ex__',
 '__repr__',
 '__rfloordiv__',
 '__rmatmul__',
 '__rmod__',
 '__rmul__',
 '__ror__',
 '__round__',
 '__rpow__',
 '__rsub__',
 '__rtruediv__',
 '__rxor__',
 '__setattr__',
 '__setitem__',
 '__setstate__',
 '__sizeof__',
 '__str__',
 '__sub__',
 '__subclasshook__',
 '__truediv__',
 '__weakref__',
 '__xor__',
 '_accessors',
 '_accum_func',
 '_add_numeric_operations',
 '_agg_by_level',
 '_agg_examples_doc',
 '_agg_see_also_doc',
 '_align_frame',
 '_align_series',
 '_append',
 '_arith_method',
 '_as_manager',
 '_attrs',
 '_binop',
 '_can_hold_na',
 '_check_inplace_and_allows_duplicate_labels',
 '_check_inplace_setting',
 '_check_is_chained_assignment_possible',
 '_check_label_or_level_ambiguity',
 '_check_setitem_copy',
 '_clear_item_cache',
 '_clip_with_one_bound',
 '_clip_with_scalar',
 '_cmp_method',
 '_consolidate',
 '_consolidate_inplace',
 '_construct_axes_dict',
 '_construct_axes_from_arguments',
 '_construct_result',
 '_constructor',
 '_constructor_expanddim',
 '_convert',
 '_convert_dtypes',
 '_data',
 '_dir_additions',
 '_dir_deletions',
 '_drop_axis',
 '_drop_labels_or_levels',
 '_duplicated',
 '_find_valid_index',
 '_flags',
 '_get_axis',
 '_get_axis_name',
 '_get_axis_number',
 '_get_axis_resolvers',
 '_get_block_manager_axis',
 '_get_bool_data',
 '_get_cacher',
 '_get_cleaned_column_resolvers',
 '_get_index_resolvers',
 '_get_label_or_level_values',
 '_get_numeric_data',
 '_get_value',
 '_get_values',
 '_get_values_tuple',
 '_get_with',
 '_gotitem',
 '_hidden_attrs',
 '_indexed_same',
 '_info_axis',
 '_info_axis_name',
 '_info_axis_number',
 '_init_dict',
 '_init_mgr',
 '_inplace_method',
 '_internal_names',
 '_internal_names_set',
 '_is_cached',
 '_is_copy',
 '_is_label_or_level_reference',
 '_is_label_reference',
 '_is_level_reference',
 '_is_mixed_type',
 '_is_view',
 '_item_cache',
 '_ixs',
 '_logical_func',
 '_logical_method',
 '_map_values',
 '_maybe_update_cacher',
 '_memory_usage',
 '_metadata',
 '_mgr',
 '_min_count_stat_function',
 '_name',
 '_needs_reindex_multi',
 '_protect_consolidate',
 '_reduce',
 '_reindex_axes',
 '_reindex_indexer',
 '_reindex_multi',
 '_reindex_with_indexers',
 '_rename',
 '_replace_single',
 '_repr_data_resource_',
 '_repr_latex_',
 '_reset_cache',
 '_reset_cacher',
 '_set_as_cached',
 '_set_axis',
 '_set_axis_name',
 '_set_axis_nocheck',
 '_set_is_copy',
 '_set_labels',
 '_set_name',
 '_set_value',
 '_set_values',
 '_set_with',
 '_set_with_engine',
 '_slice',
 '_stat_axis',
 '_stat_axis_name',
 '_stat_axis_number',
 '_stat_function',
 '_stat_function_ddof',
 '_take',
 '_take_with_is_copy',
 '_typ',
 '_update_inplace',
 '_validate_dtype',
 '_values',
 '_where',
 'a',
 'abs',
 'add',
 'add_prefix',
 'add_suffix',
 'agg',
 'aggregate',
 'align',
 'all',
 'any',
 'append',
 'apply',
 'argmax',
 'argmin',
 'argsort',
 'array',
 'asfreq',
 'asof',
 'astype',
 'at',
 'at_time',
 'attrs',
 'autocorr',
 'axes',
 'b',
 'backfill',
 'between',
 'between_time',
 'bfill',
 'bool',
 'c',
 'clip',
 'combine',
 'combine_first',
 'compare',
 'convert_dtypes',
 'copy',
 'corr',
 'count',
 'cov',
 'cummax',
 'cummin',
 'cumprod',
 'cumsum',
 'd',
 'describe',
 'diff',
 'div',
 'divide',
 'divmod',
 'dot',
 'drop',
 'drop_duplicates',
 'droplevel',
 'dropna',
 'dtype',
 'dtypes',
 'duplicated',
 'empty',
 'eq',
 'equals',
 'ewm',
 'expanding',
 'explode',
 'factorize',
 'ffill',
 'fillna',
 'filter',
 'first',
 'first_valid_index',
 'flags',
 'floordiv',
 'ge',
 'get',
 'groupby',
 'gt',
 'hasnans',
 'head',
 'hist',
 'iat',
 'idxmax',
 'idxmin',
 'iloc',
 'index',
 'infer_objects',
 'info',
 'interpolate',
 'is_monotonic',
 'is_monotonic_decreasing',
 'is_monotonic_increasing',
 'is_unique',
 'isin',
 'isna',
 'isnull',
 'item',
 'items',
 'iteritems',
 'keys',
 'kurt',
 'kurtosis',
 'last',
 'last_valid_index',
 'le',
 'loc',
 'lt',
 'mad',
 'map',
 'mask',
 'max',
 'mean',
 'median',
 'memory_usage',
 'min',
 'mod',
 'mode',
 'mul',
 'multiply',
 'name',
 'nbytes',
 'ndim',
 'ne',
 'nlargest',
 'notna',
 'notnull',
 'nsmallest',
 'nunique',
 'pad',
 'pct_change',
 'pipe',
 'plot',
 'pop',
 'pow',
 'prod',
 'product',
 'quantile',
 'radd',
 'rank',
 'ravel',
 'rdiv',
 'rdivmod',
 'reindex',
 'reindex_like',
 'rename',
 'rename_axis',
 'reorder_levels',
 'repeat',
 'replace',
 'resample',
 'reset_index',
 'rfloordiv',
 'rmod',
 'rmul',
 'rolling',
 'round',
 'rpow',
 'rsub',
 'rtruediv',
 'sample',
 'searchsorted',
 'sem',
 'set_axis',
 'set_flags',
 'shape',
 'shift',
 'size',
 'skew',
 'slice_shift',
 'sort_index',
 'sort_values',
 'squeeze',
 'std',
 'sub',
 'subtract',
 'sum',
 'swapaxes',
 'swaplevel',
 'tail',
 'take',
 'to_clipboard',
 'to_csv',
 'to_dict',
 'to_excel',
 'to_frame',
 'to_hdf',
 'to_json',
 'to_latex',
 'to_list',
 'to_markdown',
 'to_numpy',
 'to_period',
 'to_pickle',
 'to_sql',
 'to_string',
 'to_timestamp',
 'to_xarray',
 'transform',
 'transpose',
 'truediv',
 'truncate',
 'tz_convert',
 'tz_localize',
 'unique',
 'unstack',
 'update',
 'value_counts',
 'values',
 'var',
 'view',
 'where',
 'xs']
s.mean()
2.5
s.describe()
count    4.000000
mean     2.500000
std      1.290994
min      1.000000
25%      1.750000
50%      2.500000
75%      3.250000
max      4.000000
dtype: float64
Dataframes#
data = {
    'country': ['Belgium', 'France', 'Germany', 'Netherlands', 'United Kingdom'],
    'population': [11.3, 64.3, 81.3, 16.9, 64.9],
    'area': [30510, 671308, 357050, 41526, 244820],
    'capital': ['Brussels', 'Paris', 'Berlin', 'Amsterdam', 'London']
}
df = pd.DataFrame(data)
df
| country | population | area | capital | |
|---|---|---|---|---|
| 0 | Belgium | 11.3 | 30510 | Brussels |
| 1 | France | 64.3 | 671308 | Paris |
| 2 | Germany | 81.3 | 357050 | Berlin |
| 3 | Netherlands | 16.9 | 41526 | Amsterdam |
| 4 | United Kingdom | 64.9 | 244820 | London |
df['country']
0           Belgium
1            France
2           Germany
3       Netherlands
4    United Kingdom
Name: country, dtype: object
df.columns
Index(['country', 'population', 'area', 'capital'], dtype='object')
df.set_index('country') # does not change original data
| population | area | capital | |
|---|---|---|---|
| country | |||
| Belgium | 11.3 | 30510 | Brussels |
| France | 64.3 | 671308 | Paris |
| Germany | 81.3 | 357050 | Berlin |
| Netherlands | 16.9 | 41526 | Amsterdam |
| United Kingdom | 64.9 | 244820 | London |
df
| country | population | area | capital | |
|---|---|---|---|---|
| 0 | Belgium | 11.3 | 30510 | Brussels |
| 1 | France | 64.3 | 671308 | Paris |
| 2 | Germany | 81.3 | 357050 | Berlin |
| 3 | Netherlands | 16.9 | 41526 | Amsterdam |
| 4 | United Kingdom | 64.9 | 244820 | London |
to save changes
reassign
use
inplaceoption
# df = df.set_index('country') # reassign
df.set_index('country', inplace=True)
df
| population | area | capital | |
|---|---|---|---|
| country | |||
| Belgium | 11.3 | 30510 | Brussels |
| France | 64.3 | 671308 | Paris |
| Germany | 81.3 | 357050 | Berlin |
| Netherlands | 16.9 | 41526 | Amsterdam |
| United Kingdom | 64.9 | 244820 | London |
Select an individual element - return the capital of France?
df['capital']['France']
'Paris'
df.loc['France', 'capital']
'Paris'
df['density'] = df['population'] / df['area'] * 10**6
df
| population | area | capital | density | |
|---|---|---|---|---|
| country | ||||
| Belgium | 11.3 | 30510 | Brussels | 370.370370 |
| France | 64.3 | 671308 | Paris | 95.783158 |
| Germany | 81.3 | 357050 | Berlin | 227.699202 |
| Netherlands | 16.9 | 41526 | Amsterdam | 406.973944 |
| United Kingdom | 64.9 | 244820 | London | 265.092721 |
df['density'] > 300
country
Belgium            True
France            False
Germany           False
Netherlands        True
United Kingdom    False
Name: density, dtype: bool
df[df['density'] > 300]
| population | area | capital | density | |
|---|---|---|---|---|
| country | ||||
| Belgium | 11.3 | 30510 | Brussels | 370.370370 |
| Netherlands | 16.9 | 41526 | Amsterdam | 406.973944 |
df.sort_values('area')
| population | area | capital | density | |
|---|---|---|---|---|
| country | ||||
| Belgium | 11.3 | 30510 | Brussels | 370.370370 |
| Netherlands | 16.9 | 41526 | Amsterdam | 406.973944 |
| United Kingdom | 64.9 | 244820 | London | 265.092721 |
| Germany | 81.3 | 357050 | Berlin | 227.699202 |
| France | 64.3 | 671308 | Paris | 95.783158 |
What is the mean population for EU countries in this collection
df.index
Index(['Belgium', 'France', 'Germany', 'Netherlands', 'United Kingdom'], dtype='object', name='country')
eu_countries = df.index != 'United Kingdom'
eu_countries
array([ True, True, True, True, False])
df.loc[eu_countries]
| population | area | capital | density | |
|---|---|---|---|---|
| country | ||||
| Belgium | 11.3 | 30510 | Brussels | 370.370370 |
| France | 64.3 | 671308 | Paris | 95.783158 |
| Germany | 81.3 | 357050 | Berlin | 227.699202 |
| Netherlands | 16.9 | 41526 | Amsterdam | 406.973944 |
df.loc[eu_countries]['population']
country
Belgium        11.3
France         64.3
Germany        81.3
Netherlands    16.9
Name: population, dtype: float64
df.loc[eu_countries]['population'].mean()
43.449999999999996
df.loc[df.index != 'United Kingdom', 'population'].mean()
43.449999999999996
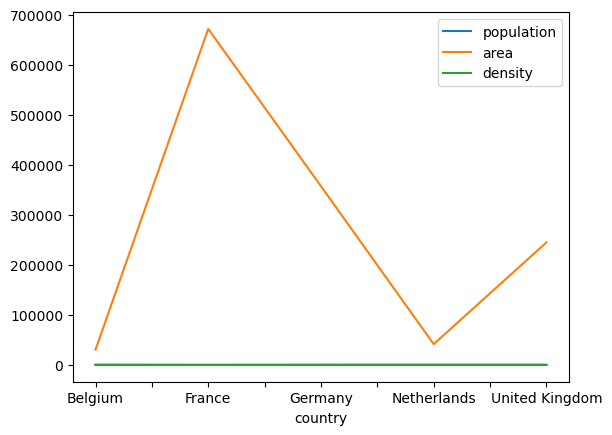
df.plot()
<Axes: xlabel='country'>
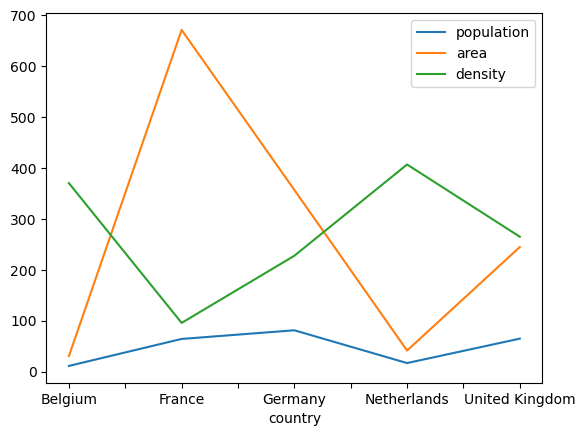
df['area'] /= 1000
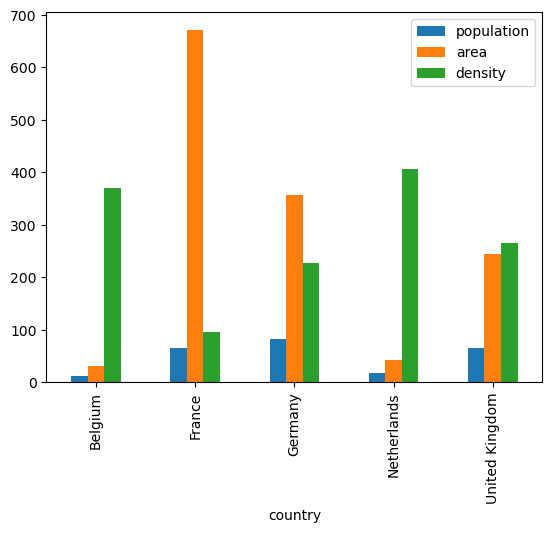
df
| population | area | capital | density | |
|---|---|---|---|---|
| country | ||||
| Belgium | 11.3 | 30.510 | Brussels | 370.370370 |
| France | 64.3 | 671.308 | Paris | 95.783158 |
| Germany | 81.3 | 357.050 | Berlin | 227.699202 |
| Netherlands | 16.9 | 41.526 | Amsterdam | 406.973944 |
| United Kingdom | 64.9 | 244.820 | London | 265.092721 |
df.plot()
<Axes: xlabel='country'>
df.plot(kind='bar')
<Axes: xlabel='country'>
export/import#
df.to_csv('countries.csv')
!cat countries.csv
country,population,area,capital,density
Belgium,11.3,30.51,Brussels,370.3703703703704
France,64.3,671.308,Paris,95.78315765639617
Germany,81.3,357.05,Berlin,227.69920179246603
Netherlands,16.9,41.526,Amsterdam,406.97394403506235
United Kingdom,64.9,244.82,London,265.09272118290994
# !conda install --yes openpyxl
df.to_excel('countries.xlsx')
!ls countries*
countries.csv countries.xlsx
pd.read_csv('countries.csv')
| country | population | area | capital | density | |
|---|---|---|---|---|---|
| 0 | Belgium | 11.3 | 30.510 | Brussels | 370.370370 |
| 1 | France | 64.3 | 671.308 | Paris | 95.783158 |
| 2 | Germany | 81.3 | 357.050 | Berlin | 227.699202 |
| 3 | Netherlands | 16.9 | 41.526 | Amsterdam | 406.973944 |
| 4 | United Kingdom | 64.9 | 244.820 | London | 265.092721 |
pd.read_excel('countries.xlsx')
| country | population | area | capital | density | |
|---|---|---|---|---|---|
| 0 | Belgium | 11.3 | 30.510 | Brussels | 370.370370 |
| 1 | France | 64.3 | 671.308 | Paris | 95.783158 |
| 2 | Germany | 81.3 | 357.050 | Berlin | 227.699202 |
| 3 | Netherlands | 16.9 | 41.526 | Amsterdam | 406.973944 |
| 4 | United Kingdom | 64.9 | 244.820 | London | 265.092721 |