Lecture Notes 14#
Reading excel#
import pandas as pd
pd.read_csv('/home/python-lll/Downloads/survey-data - person.csv')
| id | personal | family | |
|---|---|---|---|
| 0 | dyer | William | Dyer |
| 1 | pb | Frank | Pabodie |
| 2 | lake | Anderson | Lake |
| 3 | roe | Valentina | Roerich |
| 4 | danforth | Frank | Danforth |
pd.read_excel('/home/python-lll/Downloads/survey-data.xlsx')
| id | personal | family | |
|---|---|---|---|
| 0 | dyer | William | Dyer |
| 1 | pb | Frank | Pabodie |
| 2 | lake | Anderson | Lake |
| 3 | roe | Valentina | Roerich |
| 4 | danforth | Frank | Danforth |
Use option
sheet_name=Noneto get all tabs as a dictionary
pd.read_excel('/home/python-lll/Downloads/survey-data.xlsx', sheet_name=None)
{'person':          id   personal    family
 0      dyer    William      Dyer
 1        pb      Frank   Pabodie
 2      lake   Anderson      Lake
 3       roe  Valentina   Roerich
 4  danforth      Frank  Danforth,
 'site':     name    lat    long
 0   DR-1 -49.85 -128.57
 1   DR-3 -47.15 -126.72
 2  MSK-4 -48.87 -123.40,
 'survey':     taken person quant  reading
 0     619   dyer   rad     9.82
 1     619   dyer   sal     0.13
 2     622   dyer   rad     7.80
 3     622   dyer   sal     0.09
 4     734     pb   rad     8.41
 5     734   lake   sal     0.05
 6     734     pb  temp   -21.50
 7     735     pb   rad     7.22
 8     735    NaN   sal     0.06
 9     735    NaN  temp   -26.00
 10    751     pb   rad     4.35
 11    751     pb  temp   -18.50
 12    751   lake   sal     0.10
 13    752   lake   rad     2.19
 14    752   lake   sal     0.09
 15    752   lake  temp   -16.00
 16    752    roe   sal    41.60
 17    837   lake   rad     1.46
 18    837   lake   sal     0.21
 19    837    roe   sal    22.50
 20    844    roe   rad    11.25,
 'visited':     id   site      dated
 0  619   DR-1 1927-02-08
 1  622   DR-1 1927-02-10
 2  734   DR-3 1930-01-07
 3  735   DR-3 1930-01-12
 4  751   DR-3 1930-02-26
 5  752   DR-3        NaT
 6  837  MSK-4 1932-01-14
 7  844   DR-1 1932-03-22}
dfs = pd.read_excel('/home/python-lll/Downloads/survey-data.xlsx', sheet_name=None)
dfs['person']
| id | personal | family | |
|---|---|---|---|
| 0 | dyer | William | Dyer |
| 1 | pb | Frank | Pabodie |
| 2 | lake | Anderson | Lake |
| 3 | roe | Valentina | Roerich |
| 4 | danforth | Frank | Danforth |
Reading google spreadsheets#
Two steps: download and read from local disk witn
read_excelOne step: Modify url with to end with
.../export?format=xlsxand pass toread_excel
dfs = pd.read_excel('https://docs.google.com/spreadsheets/d/1VVw6O5ncoc2R-bBvu1Xc0PqylA6tKW2pyh5bDHhE_r8/export?format=xlsx', sheet_name=None)
dfs['person']
| id | personal | family | |
|---|---|---|---|
| 0 | dyer | William | Dyer |
| 1 | pb | Frank | Pabodie |
| 2 | lake | Anderson | Lake |
| 3 | roe | Valentina | Roerich |
| 4 | danforth | Frank | Danforth |
dfs.keys()
dict_keys(['person', 'site', 'survey', 'visited'])
person = dfs['person']
site = dfs['site']
survey = dfs['survey']
visited = dfs['visited']
person
| id | personal | family | |
|---|---|---|---|
| 0 | dyer | William | Dyer |
| 1 | pb | Frank | Pabodie |
| 2 | lake | Anderson | Lake |
| 3 | roe | Valentina | Roerich |
| 4 | danforth | Frank | Danforth |
Common operations with dataframes#
Select columns#
person[['personal', 'family']]
| personal | family | |
|---|---|---|
| 0 | William | Dyer |
| 1 | Frank | Pabodie |
| 2 | Anderson | Lake |
| 3 | Valentina | Roerich |
| 4 | Frank | Danforth |
Get unique values in a column#
survey # which are the unique quantities we measure?
| taken | person | quant | reading | |
|---|---|---|---|---|
| 0 | 619 | dyer | rad | 9.82 |
| 1 | 619 | dyer | sal | 0.13 |
| 2 | 622 | dyer | rad | 7.80 |
| 3 | 622 | dyer | sal | 0.09 |
| 4 | 734 | pb | rad | 8.41 |
| 5 | 734 | lake | sal | 0.05 |
| 6 | 734 | pb | temp | -21.50 |
| 7 | 735 | pb | rad | 7.22 |
| 8 | 735 | NaN | sal | 0.06 |
| 9 | 735 | NaN | temp | -26.00 |
| 10 | 751 | pb | rad | 4.35 |
| 11 | 751 | pb | temp | -18.50 |
| 12 | 751 | lake | sal | 0.10 |
| 13 | 752 | lake | rad | 2.19 |
| 14 | 752 | lake | sal | 0.09 |
| 15 | 752 | lake | temp | -16.00 |
| 16 | 752 | roe | sal | 41.60 |
| 17 | 837 | lake | rad | 1.46 |
| 18 | 837 | lake | sal | 0.21 |
| 19 | 837 | roe | sal | 22.50 |
| 20 | 844 | roe | rad | 11.25 |
survey['quant']
0      rad
1      sal
2      rad
3      sal
4      rad
5      sal
6     temp
7      rad
8      sal
9     temp
10     rad
11    temp
12     sal
13     rad
14     sal
15    temp
16     sal
17     rad
18     sal
19     sal
20     rad
Name: quant, dtype: object
Using the built-in
setUsing the pandas Series method
unique
set(survey['quant'])
{'rad', 'sal', 'temp'}
survey['quant'].unique()
array(['rad', 'sal', 'temp'], dtype=object)
If we want to know how the values are distributed
survey['quant'].value_counts()
sal     9
rad     8
temp    4
Name: quant, dtype: int64
sorting by a column#
person
| id | personal | family | |
|---|---|---|---|
| 0 | dyer | William | Dyer |
| 1 | pb | Frank | Pabodie |
| 2 | lake | Anderson | Lake |
| 3 | roe | Valentina | Roerich |
| 4 | danforth | Frank | Danforth |
person.sort_values('family')
| id | personal | family | |
|---|---|---|---|
| 4 | danforth | Frank | Danforth |
| 0 | dyer | William | Dyer |
| 2 | lake | Anderson | Lake |
| 1 | pb | Frank | Pabodie |
| 3 | roe | Valentina | Roerich |
filtering with boolean Series#
visited
| id | site | dated | |
|---|---|---|---|
| 0 | 619 | DR-1 | 1927-02-08 |
| 1 | 622 | DR-1 | 1927-02-10 |
| 2 | 734 | DR-3 | 1930-01-07 |
| 3 | 735 | DR-3 | 1930-01-12 |
| 4 | 751 | DR-3 | 1930-02-26 |
| 5 | 752 | DR-3 | NaT |
| 6 | 837 | MSK-4 | 1932-01-14 |
| 7 | 844 | DR-1 | 1932-03-22 |
at_dr_1 = visited['site'] == 'DR-1'
at_dr_1
0     True
1     True
2    False
3    False
4    False
5    False
6    False
7     True
Name: site, dtype: bool
visited[at_dr_1]
| id | site | dated | |
|---|---|---|---|
| 0 | 619 | DR-1 | 1927-02-08 |
| 1 | 622 | DR-1 | 1927-02-10 |
| 7 | 844 | DR-1 | 1932-03-22 |
Combining with logical operators
|for OR&for AND
at_dr_1_or_3 = (visited['site'] == 'DR-1') | (visited['site'] == 'DR-3')
at_dr_1_or_3
0     True
1     True
2     True
3     True
4     True
5     True
6    False
7     True
Name: site, dtype: bool
visited[at_dr_1_or_3]
| id | site | dated | |
|---|---|---|---|
| 0 | 619 | DR-1 | 1927-02-08 |
| 1 | 622 | DR-1 | 1927-02-10 |
| 2 | 734 | DR-3 | 1930-01-07 |
| 3 | 735 | DR-3 | 1930-01-12 |
| 4 | 751 | DR-3 | 1930-02-26 |
| 5 | 752 | DR-3 | NaT |
| 7 | 844 | DR-1 | 1932-03-22 |
'DR-3'.startswith('DR')
True
at_dr = visited['site'].str.startswith('DR')
at_dr
0     True
1     True
2     True
3     True
4     True
5     True
6    False
7     True
Name: site, dtype: bool
visited[at_dr]
| id | site | dated | |
|---|---|---|---|
| 0 | 619 | DR-1 | 1927-02-08 |
| 1 | 622 | DR-1 | 1927-02-10 |
| 2 | 734 | DR-3 | 1930-01-07 |
| 3 | 735 | DR-3 | 1930-01-12 |
| 4 | 751 | DR-3 | 1930-02-26 |
| 5 | 752 | DR-3 | NaT |
| 7 | 844 | DR-1 | 1932-03-22 |
select all record from survey with salinity values outsited [0, 1]#
survey
| taken | person | quant | reading | |
|---|---|---|---|---|
| 0 | 619 | dyer | rad | 9.82 |
| 1 | 619 | dyer | sal | 0.13 |
| 2 | 622 | dyer | rad | 7.80 |
| 3 | 622 | dyer | sal | 0.09 |
| 4 | 734 | pb | rad | 8.41 |
| 5 | 734 | lake | sal | 0.05 |
| 6 | 734 | pb | temp | -21.50 |
| 7 | 735 | pb | rad | 7.22 |
| 8 | 735 | NaN | sal | 0.06 |
| 9 | 735 | NaN | temp | -26.00 |
| 10 | 751 | pb | rad | 4.35 |
| 11 | 751 | pb | temp | -18.50 |
| 12 | 751 | lake | sal | 0.10 |
| 13 | 752 | lake | rad | 2.19 |
| 14 | 752 | lake | sal | 0.09 |
| 15 | 752 | lake | temp | -16.00 |
| 16 | 752 | roe | sal | 41.60 |
| 17 | 837 | lake | rad | 1.46 |
| 18 | 837 | lake | sal | 0.21 |
| 19 | 837 | roe | sal | 22.50 |
| 20 | 844 | roe | rad | 11.25 |
sal = survey['quant'] == 'sal'
sal
0     False
1      True
2     False
3      True
4     False
5      True
6     False
7     False
8      True
9     False
10    False
11    False
12     True
13    False
14     True
15    False
16     True
17    False
18     True
19     True
20    False
Name: quant, dtype: bool
out_of_range = (survey['reading'] > 1) | (survey['reading'] < 0) # | is a logical OR operation
out_of_range
0      True
1     False
2      True
3     False
4      True
5     False
6      True
7      True
8     False
9      True
10     True
11     True
12    False
13     True
14    False
15     True
16     True
17     True
18    False
19     True
20     True
Name: reading, dtype: bool
sal & out_of_range # & is a logical AND operation
0     False
1     False
2     False
3     False
4     False
5     False
6     False
7     False
8     False
9     False
10    False
11    False
12    False
13    False
14    False
15    False
16     True
17    False
18    False
19     True
20    False
dtype: bool
survey[sal & out_of_range]
| taken | person | quant | reading | |
|---|---|---|---|---|
| 16 | 752 | roe | sal | 41.6 |
| 19 | 837 | roe | sal | 22.5 |
Add new columns#
Provide temp readings in Fahrenheit#
fahrenheit = survey[survey['quant'] == 'temp']['reading']*9/5 + 32
fahrenheit
6     -6.7
9    -14.8
11    -1.3
15     3.2
Name: reading, dtype: float64
survey['fahrenheit'] = fahrenheit
survey
| taken | person | quant | reading | fahrenheit | |
|---|---|---|---|---|---|
| 0 | 619 | dyer | rad | 9.82 | NaN |
| 1 | 619 | dyer | sal | 0.13 | NaN |
| 2 | 622 | dyer | rad | 7.80 | NaN |
| 3 | 622 | dyer | sal | 0.09 | NaN |
| 4 | 734 | pb | rad | 8.41 | NaN |
| 5 | 734 | lake | sal | 0.05 | NaN |
| 6 | 734 | pb | temp | -21.50 | -6.7 |
| 7 | 735 | pb | rad | 7.22 | NaN |
| 8 | 735 | NaN | sal | 0.06 | NaN |
| 9 | 735 | NaN | temp | -26.00 | -14.8 |
| 10 | 751 | pb | rad | 4.35 | NaN |
| 11 | 751 | pb | temp | -18.50 | -1.3 |
| 12 | 751 | lake | sal | 0.10 | NaN |
| 13 | 752 | lake | rad | 2.19 | NaN |
| 14 | 752 | lake | sal | 0.09 | NaN |
| 15 | 752 | lake | temp | -16.00 | 3.2 |
| 16 | 752 | roe | sal | 41.60 | NaN |
| 17 | 837 | lake | rad | 1.46 | NaN |
| 18 | 837 | lake | sal | 0.21 | NaN |
| 19 | 837 | roe | sal | 22.50 | NaN |
| 20 | 844 | roe | rad | 11.25 | NaN |
Missing data#
visited # find missing data
| id | site | dated | |
|---|---|---|---|
| 0 | 619 | DR-1 | 1927-02-08 |
| 1 | 622 | DR-1 | 1927-02-10 |
| 2 | 734 | DR-3 | 1930-01-07 |
| 3 | 735 | DR-3 | 1930-01-12 |
| 4 | 751 | DR-3 | 1930-02-26 |
| 5 | 752 | DR-3 | NaT |
| 6 | 837 | MSK-4 | 1932-01-14 |
| 7 | 844 | DR-1 | 1932-03-22 |
missing_date = visited['dated'].isna() # is not valid
missing_date
0    False
1    False
2    False
3    False
4    False
5     True
6    False
7    False
Name: dated, dtype: bool
visited[missing_date]
| id | site | dated | |
|---|---|---|---|
| 5 | 752 | DR-3 | NaT |
what is the most recent reading#
visited
| id | site | dated | |
|---|---|---|---|
| 0 | 619 | DR-1 | 1927-02-08 |
| 1 | 622 | DR-1 | 1927-02-10 |
| 2 | 734 | DR-3 | 1930-01-07 |
| 3 | 735 | DR-3 | 1930-01-12 |
| 4 | 751 | DR-3 | 1930-02-26 |
| 5 | 752 | DR-3 | NaT |
| 6 | 837 | MSK-4 | 1932-01-14 |
| 7 | 844 | DR-1 | 1932-03-22 |
visited.sort_values('dated', ascending=False)
| id | site | dated | |
|---|---|---|---|
| 7 | 844 | DR-1 | 1932-03-22 |
| 6 | 837 | MSK-4 | 1932-01-14 |
| 4 | 751 | DR-3 | 1930-02-26 |
| 3 | 735 | DR-3 | 1930-01-12 |
| 2 | 734 | DR-3 | 1930-01-07 |
| 1 | 622 | DR-1 | 1927-02-10 |
| 0 | 619 | DR-1 | 1927-02-08 |
| 5 | 752 | DR-3 | NaT |
visited.sort_values('dated', ascending=False).head(1)
| id | site | dated | |
|---|---|---|---|
| 7 | 844 | DR-1 | 1932-03-22 |
operation with grouping#
what is the average measurement for each person and quantity#
survey
| taken | person | quant | reading | fahrenheit | |
|---|---|---|---|---|---|
| 0 | 619 | dyer | rad | 9.82 | NaN |
| 1 | 619 | dyer | sal | 0.13 | NaN |
| 2 | 622 | dyer | rad | 7.80 | NaN |
| 3 | 622 | dyer | sal | 0.09 | NaN |
| 4 | 734 | pb | rad | 8.41 | NaN |
| 5 | 734 | lake | sal | 0.05 | NaN |
| 6 | 734 | pb | temp | -21.50 | -6.7 |
| 7 | 735 | pb | rad | 7.22 | NaN |
| 8 | 735 | NaN | sal | 0.06 | NaN |
| 9 | 735 | NaN | temp | -26.00 | -14.8 |
| 10 | 751 | pb | rad | 4.35 | NaN |
| 11 | 751 | pb | temp | -18.50 | -1.3 |
| 12 | 751 | lake | sal | 0.10 | NaN |
| 13 | 752 | lake | rad | 2.19 | NaN |
| 14 | 752 | lake | sal | 0.09 | NaN |
| 15 | 752 | lake | temp | -16.00 | 3.2 |
| 16 | 752 | roe | sal | 41.60 | NaN |
| 17 | 837 | lake | rad | 1.46 | NaN |
| 18 | 837 | lake | sal | 0.21 | NaN |
| 19 | 837 | roe | sal | 22.50 | NaN |
| 20 | 844 | roe | rad | 11.25 | NaN |
survey.groupby('quant')['reading'].mean().round(2)
quant
rad      6.56
sal      7.20
temp   -20.50
Name: reading, dtype: float64
survey.groupby(['person', 'quant'])['reading'].mean().round(2)
person  quant
dyer    rad       8.81
        sal       0.11
lake    rad       1.82
        sal       0.11
        temp    -16.00
pb      rad       6.66
        temp    -20.00
roe     rad      11.25
        sal      32.05
Name: reading, dtype: float64
plotting reviewed#
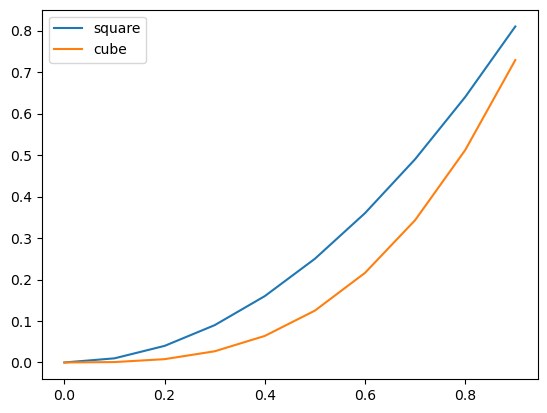
with arrays#
import numpy as np
import matplotlib.pyplot as plt
x = np.arange(0, 1, .1)
y1 = x**2
y2 = x**3
plt.plot(x, y1, label='square')
plt.plot(x, y2, label='cube')
plt.legend()
<matplotlib.legend.Legend at 0x7f54d11f7b50>
with dataframes#
pd.DataFrame({'square': y1, 'cube': y2}, index=x).plot()
<Axes: >